![]()
![]()
Facts
Data and maps
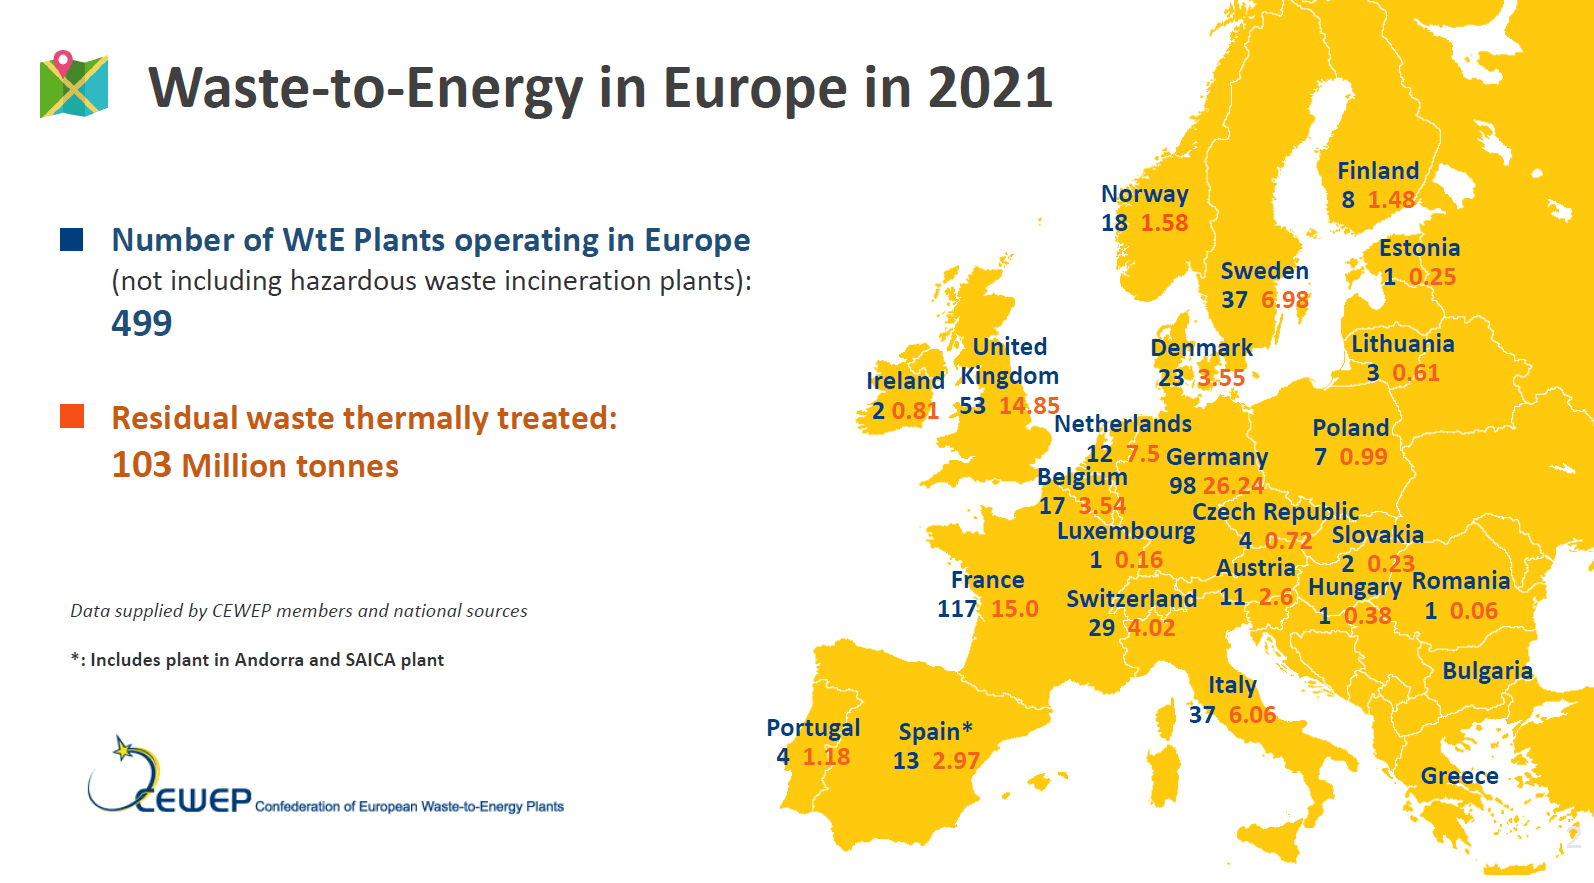
Each year, CEWEP publishes a map of Waste-to-Energy plants in Europe, based on data coming from CEWEP members and national sources.
This overview shows that Waste-to-Energy treatment capacity was overall stable compared to 2020, with a small increase in capacity.
THe overall number of facilities slightly decreased compared to 2020 due to a change in our data collection methodology.
(Click here or on the map in order to download the pdf. An interactive map can be found here)