![]()
![]()
Facts
Data and maps
1 April 2026
Each year after publication of the Eurostat figures for Municipal Waste Treatment, CEWEP produces many graphs based on this data in order to show the state of waste treatment in Europe.
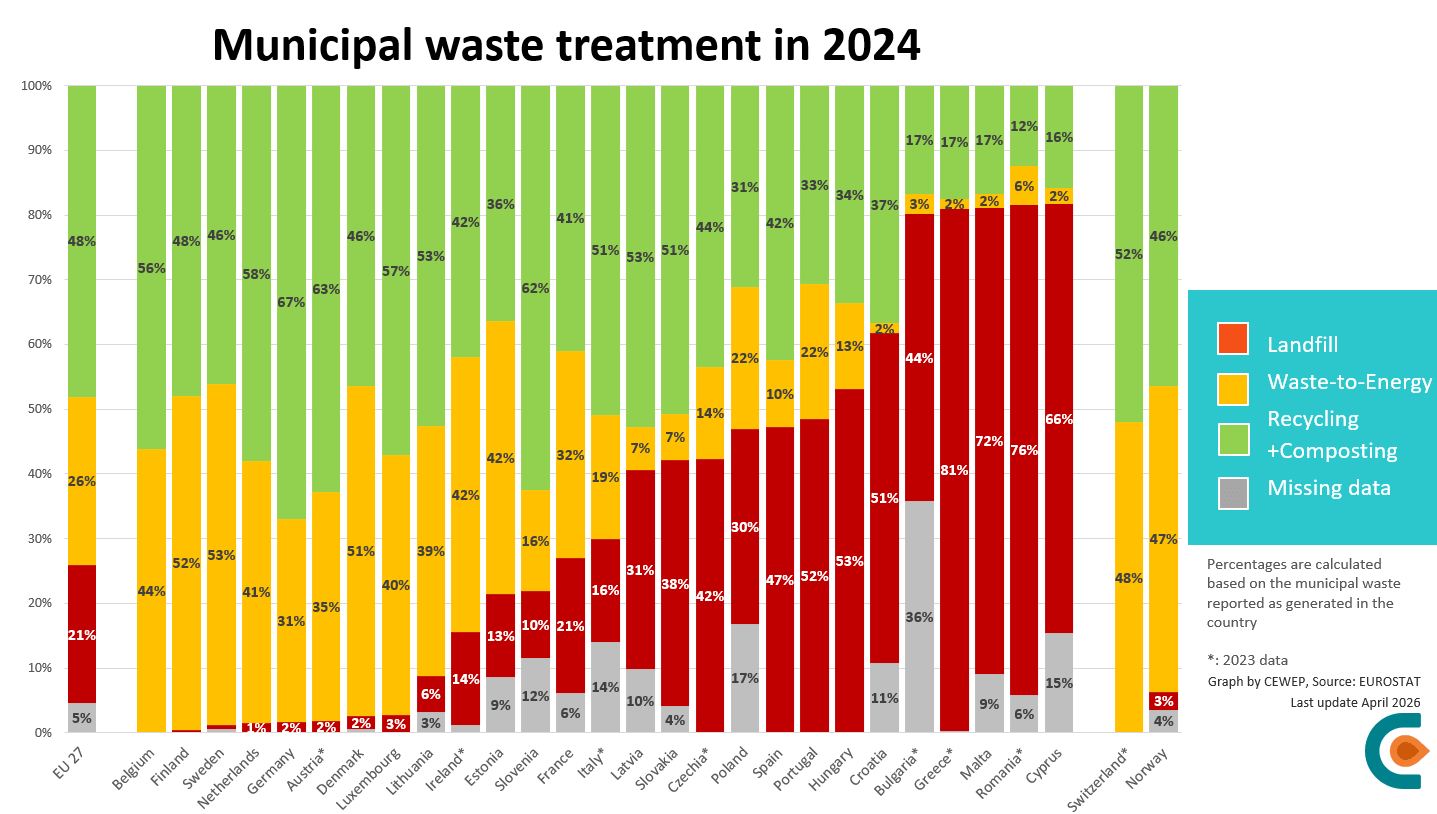
This first graph shows the share of recycling (including composting), Waste-to-Energy and landfilling of municipal waste in each EU Member State (plus Norway and Switzerland), sorted by share of landfilling. It also displays the missing data, which includes the gaps between the waste generated in the country and the waste treated.
In 2024 the leading country for recycling was Germany, with 67% of municipal waste either recycled or composted.
While in 2023 11 Member States had landfilled less than 10 % of their waste – which is the target set by the Landfill Directive for 2035, in 2024 they were only 9. There are 8 Member States that landfill more than half of their residual waste.
The graph can be downloaded here or by clicking on the picture below. Last update: April 2026
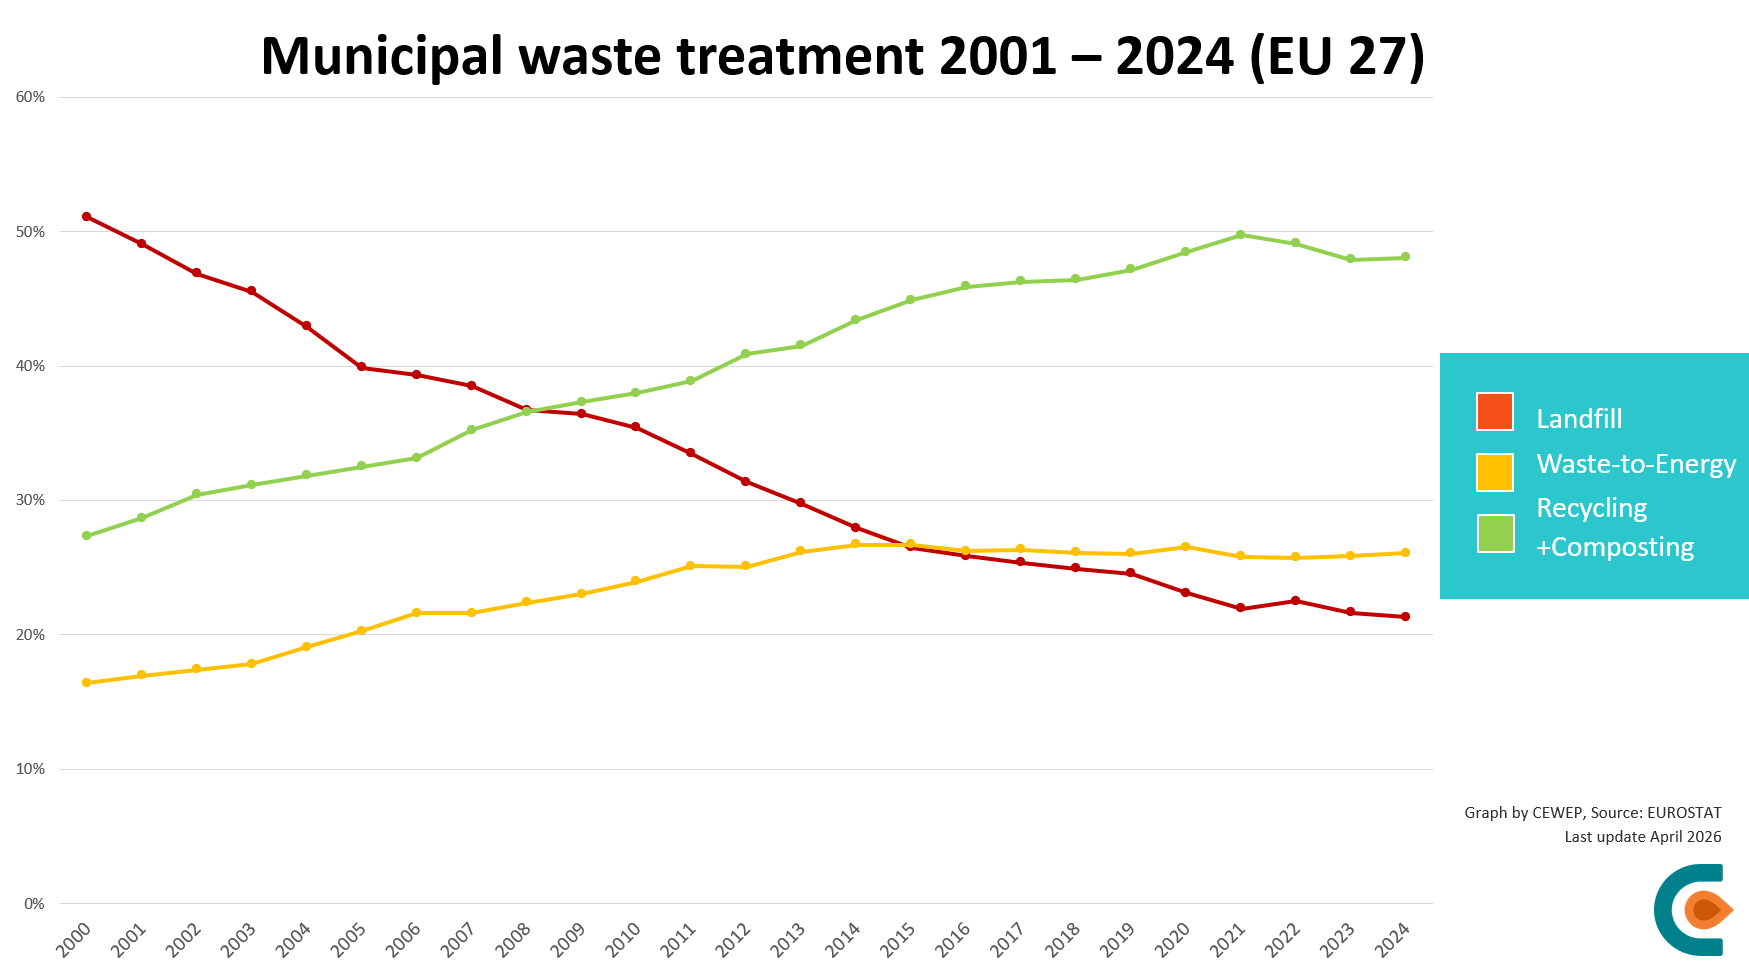
This additional graph shows the EU-level variation of the shares of waste treatment options from 2001 to 2024 (Landfilling, Waste-to-Energy, Recycling).
The share of treatment in WtE plants is stable at 26%. It has stayed between 25% and 27% since 2011 while recycling has gained 9 percentage points since then and landfilling has lost 12.
The graph can be downloaded here or by clicking on the picture below. Last update: April 2026